Math day
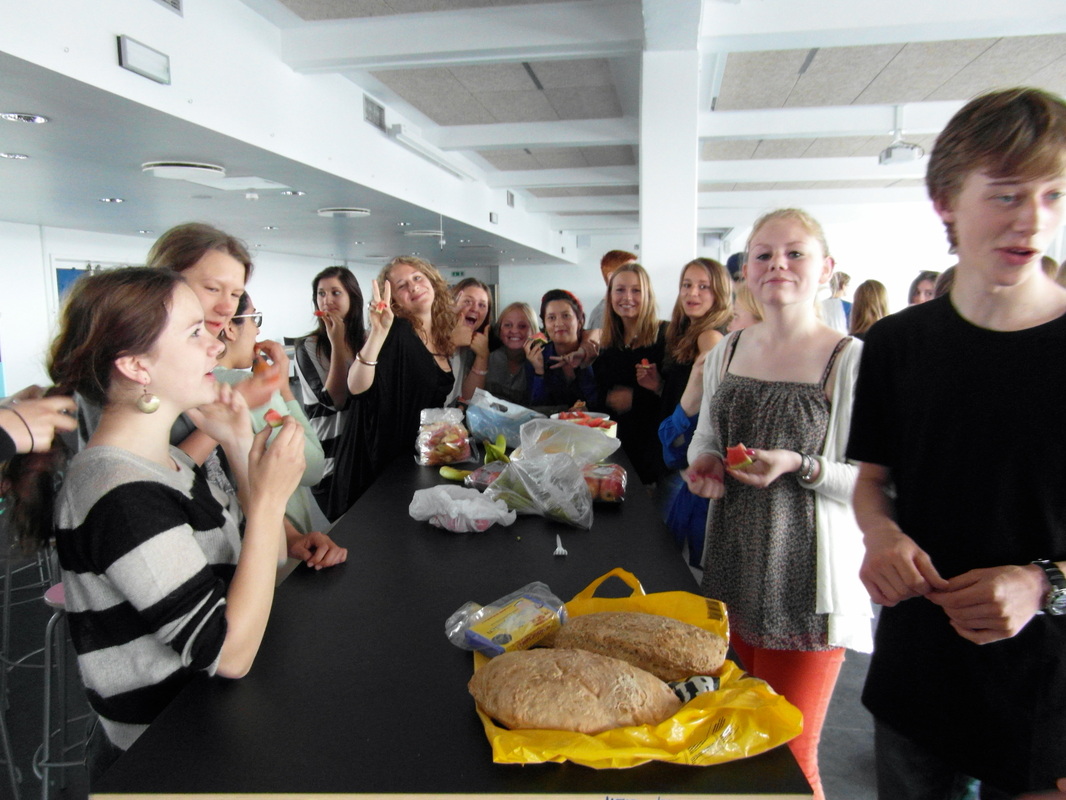
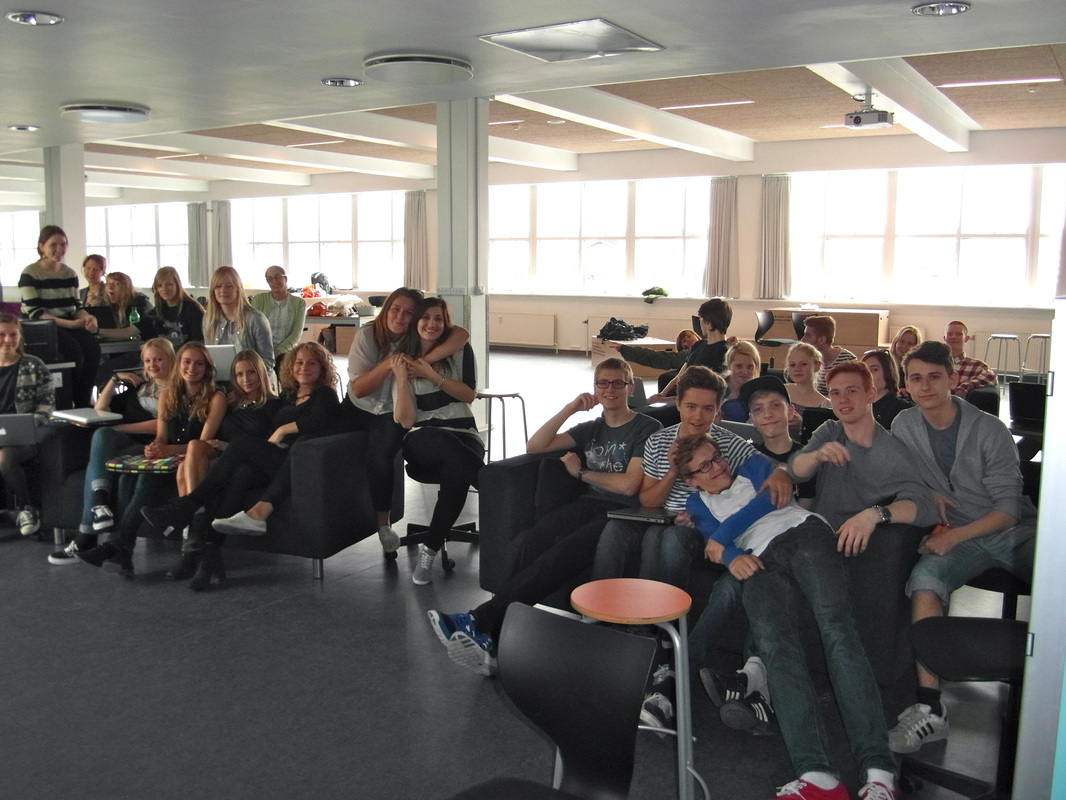
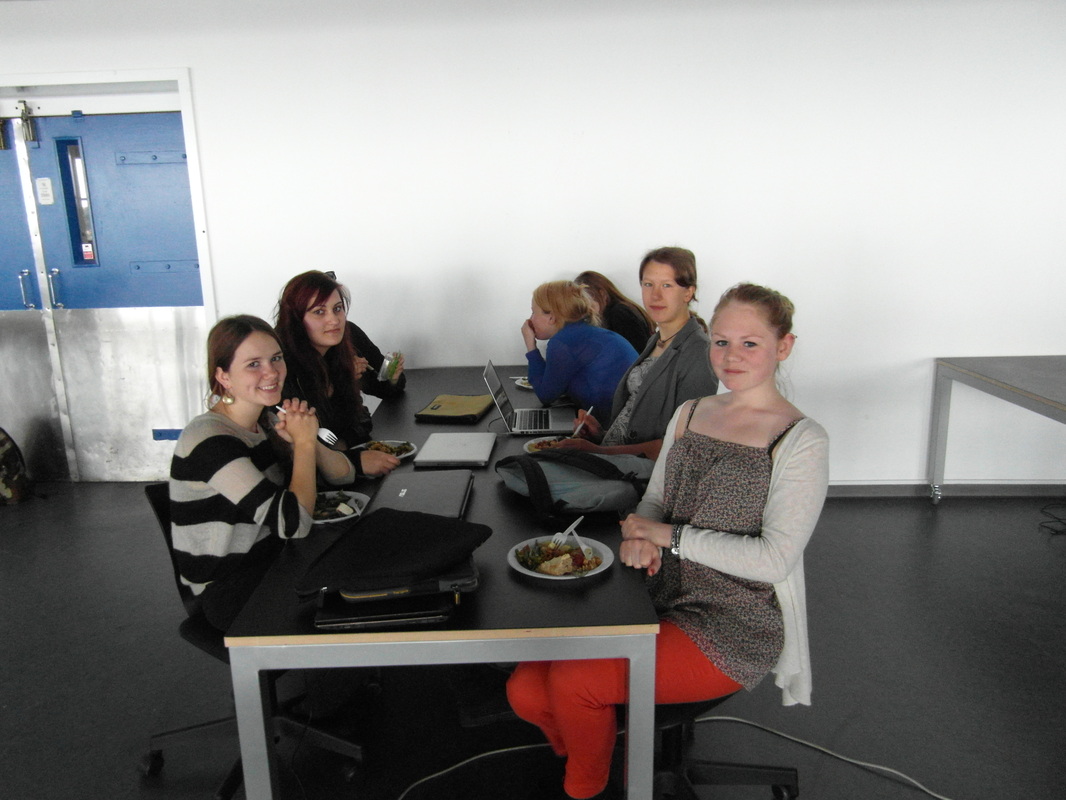
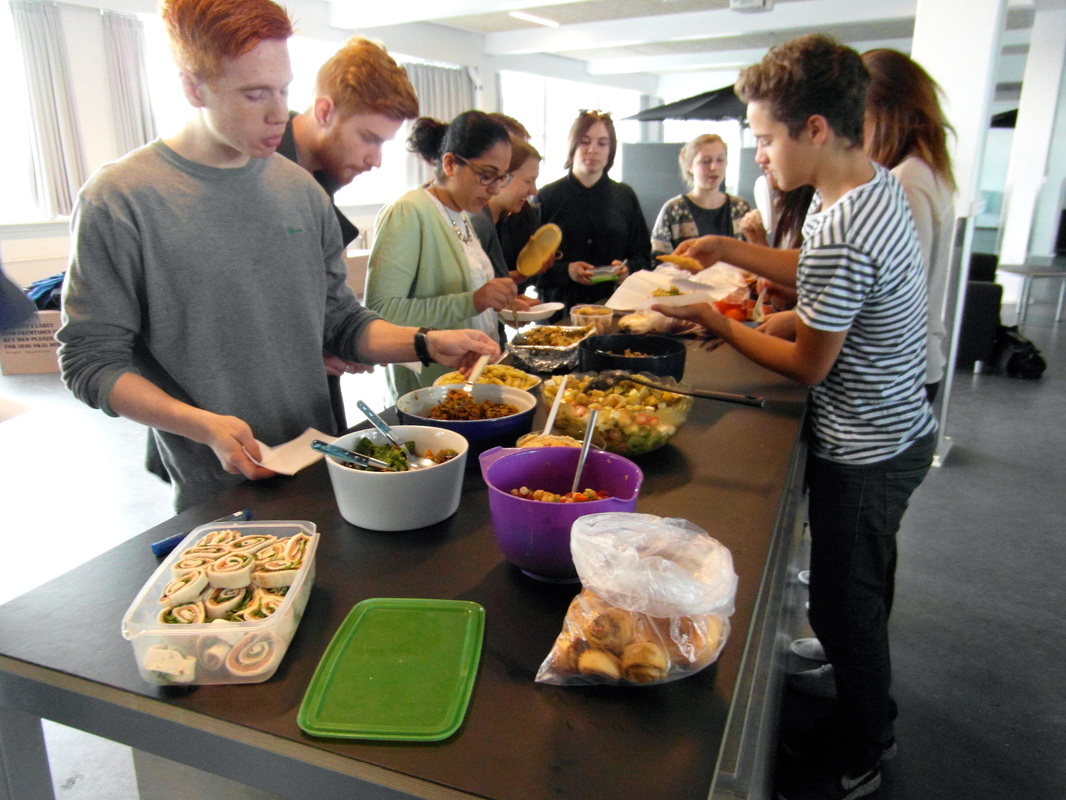
Today we have learned about descriptive statistics. We have learned some important terms, which can be used to get a better understanding, and maybe even get more out of the observations. The methods we have learned today can also be used to compare the disease frequency in different countries such as Denmark and Iceland, but also to gain more knowledge about for instance the average height and shoe size. Although we like to study mathematics we know how to mix serious work with fun, so we have also made a buffet :)))).
Some of the terms we have been using today include
Absolute frequency --> which is a term that describes the frequency of an observation.
Relative frequency --> which is a term that describes the frequency of an observation in percent.
Mean --> which is a term that describes the average of all the observations.
Mode --> which is a term that describes the most common observation.
Box plot --> we don’t really know how to describe it, but it’s so swag that we had to eat cake while we studied it.